
Web UI Dashboard
After logging in, the Web UI displays the Dashboard - your central hub for monitoring and controlling the DMX Core 100.
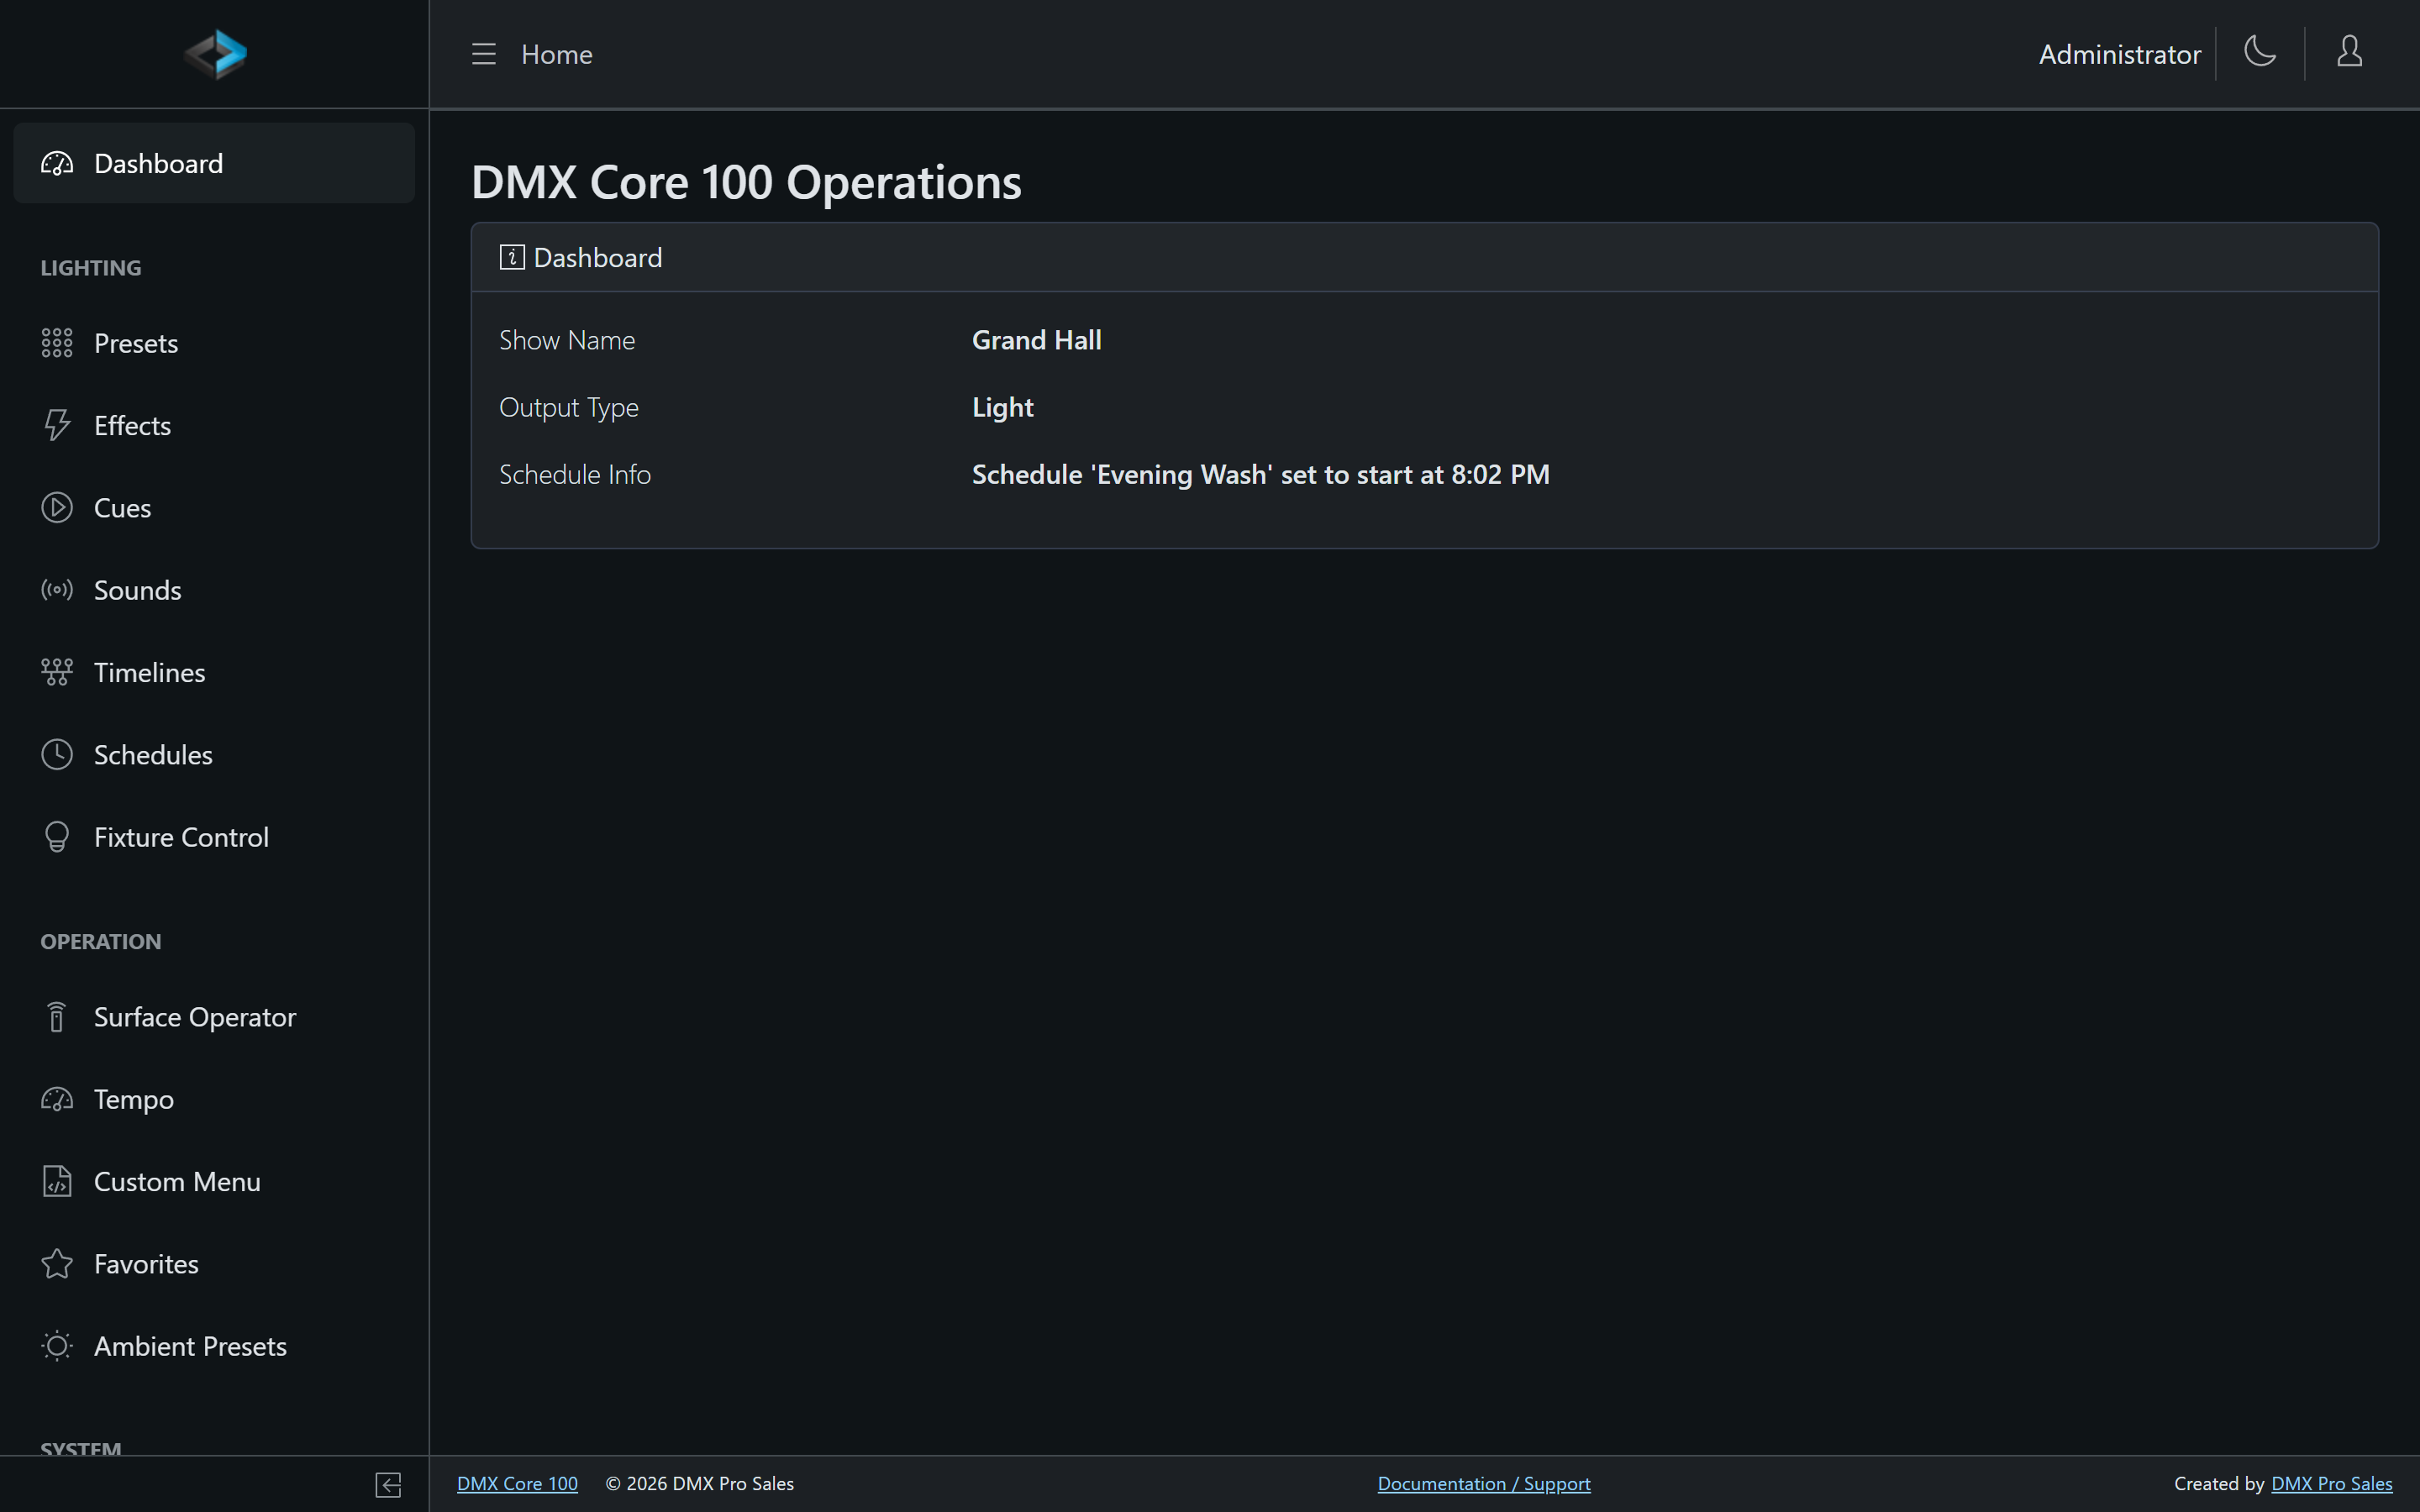
Layout
The Web UI has two main areas:
- Sidebar (left) - Navigation organized into sections. Groups under System expand and collapse.
- Main content (right) - The active page, with a breadcrumb trail at the top showing your current location.
Sidebar Navigation
| Group | Contains |
|---|---|
| Dashboard | System status, currently playing items, playback controls |
| Lighting | Presets, Effects, Cues, Sounds, Timelines, Schedules, Fixture Control |
| Operation | Surface Operator, Tempo, Custom Menu, Ambient Presets |
| Lighting Setup | Outputs, Protocol (merge & priority), Fixtures, Cue Fade Masks, Zones (with Multi-Zone Playback enabled) |
| Control & Integrations | Input Triggers, Output Events, Control Surfaces, Control Values, OSC Clients, Remote Control, MQTT, Scripts, Plugins |
| Device | System, Network, Touchscreen, Custom Menus, Installer - see Settings |
| Utilities | Audit Log, Device Monitor, Output Monitor, Record, Releases (Appliance, Windows, and macOS - not Snap Linux), System (factory reset) |
| Backup & Restore | Local and cloud backups |
| File Explorer | Browse and manage files on the device |
| User Management | Users & Roles |
Dashboard Content
The Dashboard shows:
- Currently playing items (cues, sounds, timelines) with playback controls (pause, stop, seek)
- System status including device temperatures, CPU/memory usage, storage, and network speed
- Quick actions for common operations, plus favorites when configured
Theme
The Web UI supports both light and dark themes - use the theme toggle in the top bar.